Determining Spatial Distribution of Microcystin Levels in HABs Using UAV-based Multispectral Imagery and Pigment/Toxin Correlations
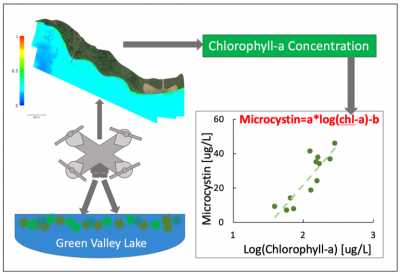
Harmful algal blooms (HABs) contain cyanobacteria which can release cyanotoxins into the aquatic environment. Microcystin are the most abundant cyanotoxin found in Iowa lakes. Grab and composite samples are collected during the summer to test for microcystin levels, but these sampling techniques cannot capture spatial variability. However, multispectral imagery detects the chlorophyll-a pigment in these cyanobacteria at high spatial resolution. A pigment/toxin correlation can then estimate the microcystin concentrations throughout the study area, resulting in a visual depiction of microcystin variability. This technique has the potential to be used as a risk-assessment tool for lake managers to understand the development and movement of HABs.
Determining Snow Transport by Atmospheric Boundary Layer Winds to Improve Snow Relocation Models
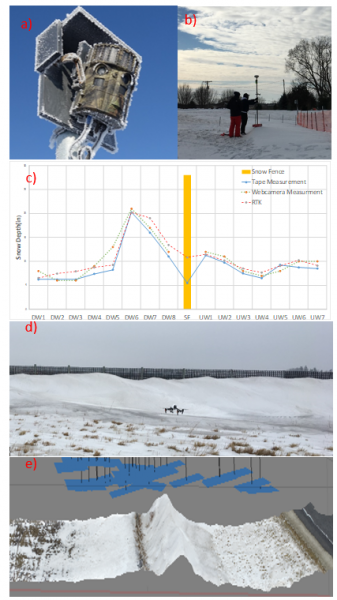
Blowing and drifting snow causes significant problems for maintaining safe driving conditions, transportation efficiency, and highway maintenance. Snow fence is designed to trap snow and prevent it from drifting onto roadways. However, the distance a snow fence must be set back from the roadway depends on how much snow is transported to the fence and how efficiently the fence traps the snow. The snow relocation coefficient (SRC) is the ratio of drifted snow to snowfall in terms of equivalent water. It is a key parameter for snow fence design. To improve estimates of snow transport by wind, we are conducting field experiments during winter to measure snow trapped by snow fence and environmental variables that contribute to snow transport using flux towers. We are developing automated image-based methods to quantify snow trapped by structural and living snow fence. Data collected in the field using survey equipment and drone imagery, as well as continuous web camera recordings are used for mapping the snow and quantify the volume of snow trapped by snow fence.
Team members and collaborators: Sarah Douglas, Hao Chen, Mohsen Vahidzadeh, Marian Muste, Mary Skopec, Greg LeFevre